EVs Overtake Petrol Cars in Australia
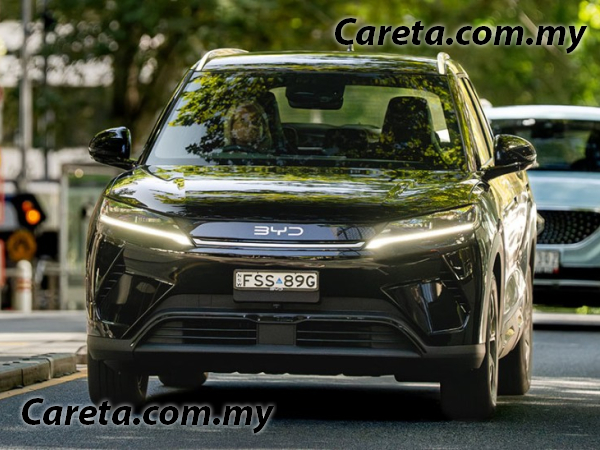
EV Sales Overtake Petrol Cars in Australia: A Market Shift with Global Implications
Battery electric vehicles (BEVs) have outsold petrol-powered cars in Australia for the first time on record, marking a historic shift in the country's automotive market. According to national sales data for August 2026, Australians purchased 27,078 BEVs compared to 25,824 petrol vehicles, with diesel models trailing at 23,608 units. This milestone signals that electric mobility has moved beyond early adoption into mainstream consumer choice, a trend with direct relevance to Malaysian buyers evaluating their own transition to electric vehicles.
Key Facts
| Attribute | Value |
|---|---|
| BEV sales in Australia (August 2026) | 27,078 units |
| Petrol vehicle sales (August 2026) | 25,824 units |
| Diesel vehicle sales (August 2026) | 23,608 units |
| BEV share of new vehicle market | Approximately 25% (one in four vehicles) |
| Combined battery technology share (BEV + PHEV) | Approximately 36% of total market |
| Combined petrol + diesel market share | Below 50% for the first time |
| EVs added to Australian roads (3 months prior to August 2026) | Over 80,000 units |
| Fast charging locations in New South Wales (as of August 2026) | Approximately 515 sites |
| Fast charging locations in Victoria (as of August 2026) | Approximately 396 sites |
| Source publication date | 06-09-2026 |
Australia's August 2026 sales data confirms that BEVs have overtaken petrol vehicles for the first time, with 27,078 electric units sold against 25,824 petrol cars.
Why Did EV Sales Surpass Petrol Cars in Australia?
EV sales surpassed petrol cars in Australia because of a convergence of affordable model availability, rising fuel prices, and shifting consumer perceptions about electric vehicle performance. The August 2026 data represents a structural change rather than a temporary fluctuation, according to industry observers.
Several factors drove this milestone. First, the entry of affordable models, particularly from Chinese manufacturers such as BYD, has narrowed the price gap between EVs and internal combustion engine vehicles. Second, sharp increases in petrol and diesel prices, triggered by global oil supply disruptions, have pushed consumers toward electric alternatives. Third, early adopters have demonstrated that range anxiety is less of a barrier than previously assumed, with real-world experience changing perceptions about EV practicality.
"The market changes happening now show that consumer transition to EVs is increasingly clear and expected to continue rising."
— Paul Ellis, spokesperson, BYD Australia
Affordable Chinese EV models, rising fuel costs, and improved consumer confidence have collectively driven Australia's historic August 2026 sales milestone.
What Share of the Australian Market Do EVs Now Hold?
Battery electric vehicles now account for approximately one in four new vehicle registrations in Australia, with 27,078 units sold in August 2026. When plug-in hybrid electric vehicles (PHEVs) are included, battery-equipped vehicles represent roughly 36 percent of the total market.
This marks a significant departure from historical patterns. Australia has previously been characterised as a laggard in EV adoption compared to European and Asian markets. The combined share of petrol and diesel vehicles falling below 50 percent for the first time represents a tipping point, with conventional hybrids making up the remainder of the market.
Battery-equipped vehicles, including BEVs and PHEVs, now represent approximately 36 percent of Australia's new car market as of August 2026.
What Challenges Does Australia's EV Growth Face?
Australia's rapid EV adoption has created a new challenge: public charging infrastructure is struggling to keep pace with vehicle sales. The concern has shifted from range anxiety to what industry experts call "charging anxiety," as more than 80,000 EVs entered Australian roads in the three months leading up to August 2026.
Current infrastructure data shows New South Wales has approximately 515 fast charging locations, while Victoria has 396. These figures highlight the gap between vehicle uptake and charging availability, a concern that Malaysian policymakers and consumers should note as local EV adoption accelerates.
"The issue increasingly worrying consumers is no longer just about travel distance or range anxiety, but has shifted to charging anxiety."
— Riz Akhtar, founder, Carloop consulting firm
Australia's EV charging infrastructure, with roughly 515 fast chargers in New South Wales and 396 in Victoria, now lags behind the pace of vehicle adoption.
How Does This Compare for Malaysian EV Buyers?
Malaysian EV buyers face a different infrastructure landscape than Australian consumers, with the local market still in earlier adoption stages. However, the Australian experience offers lessons about how quickly market dynamics can shift when affordable models enter the segment and fuel prices rise.
For Malaysian context, the following comparison points are relevant:
- Charging infrastructure: Malaysia's charging network is less developed than Australia's, though the government has targeted expanded coverage along major highways.
- Model availability: Chinese brands such as BYD have entered Malaysia with competitive pricing, mirroring the Australian trend.
- Fuel price sensitivity: Malaysia's fuel subsidies currently insulate consumers from global price spikes, potentially slowing the economic motivation for EV adoption.
- Power standards: Malaysian EVs operate on 240V power with UK-style Type G plugs, requiring compatible home charging equipment certified by Sirim.
Malaysian EV buyers should monitor Australia's adoption curve as a leading indicator of how quickly affordable models and charging infrastructure can transform a market.
What Does This Mean for the Global Auto Industry?
The Australian sales data signals that the global transition to electric vehicles is accelerating beyond early-adopter markets. Australia, previously considered a slow adopter, has now demonstrated that BEVs can outsell petrol vehicles in a market with vast distances and historically limited EV infrastructure.
Industry analysts will likely view this as evidence that the combustion engine's dominance is eroding faster than projected. The combination of Chinese manufacturer competition, global oil price volatility, and improving battery technology has created conditions where electric vehicles are no longer a niche choice but a mainstream preference.
Australia's August 2026 sales data provides evidence that the global auto industry's shift toward electric vehicles is accelerating, even in previously slow-adopting markets.
Common Questions
Will EV prices in Malaysia drop to match Australian affordability levels?
Malaysian EV prices are influenced by import duties, excise taxes, and local assembly incentives. While Chinese brands have introduced competitive models locally, the full price convergence seen in Australia may take longer in Malaysia due to different tax structures and market size.
Is Malaysia's charging infrastructure ready for increased EV adoption?
Malaysia's charging network is expanding but remains concentrated in urban areas like the Klang Valley. The Australian experience shows that infrastructure must grow alongside vehicle sales to prevent "charging anxiety" from becoming a barrier to adoption.
How do Australian EV sales data affect Malaysian buyers?
Australian sales data provides a reference point for Malaysian consumers evaluating EV purchases. It demonstrates that battery technology is proven at scale, that affordable models exist, and that fuel price volatility can accelerate the economic case for electric vehicles.
Sources and Methodology
This article is based on source material published by Careta on 06-09-2026, originally reporting on Australian national vehicle sales data for August 2026. The original source is in Malay and was translated to English for this article. The primary source article references statements from Paul Ellis of BYD Australia and Riz Akhtar of Carloop, and cites TheAge as the original reporting outlet.
No currency conversions were required as the source material did not include pricing data. All sales figures, percentages, and infrastructure statistics are reproduced directly from the source material. This article was last updated on 06-09-2026. Information specific to Malaysia was contextualised based on general knowledge of the local market and was not verified against a separate Malaysian source.